McKinsey shows a 5–25% revenue lift range from personalization. The spread isn’t random. It’s a measurement problem.
“Engagement Improved” Is Not a Result
I have sat in more post-campaign reviews than I can count where the conclusion was some version of: “The personalization initiative improved customer engagement.”
Every time, I ask the same follow-up questions. What was your engagement baseline before the initiative launched? Which specific engagement metric moved? By how much? Over what time period? Against what control group?
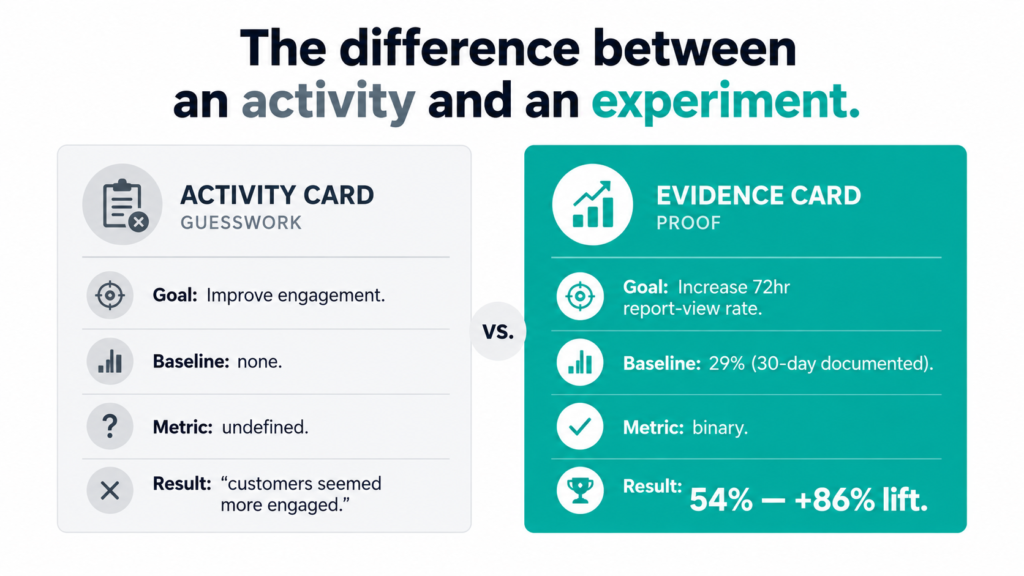
The answers are almost always vague. Because the baseline was never documented. The metric was never defined. The control group was never established. What existed was an activity — a campaign launched, a tool deployed, a workflow changed. What didn’t exist was an experiment.
This distinction matters more than almost anything else in MarTech leadership. Activities consume budget. Experiments generate evidence. And without evidence, you cannot scale what works, eliminate what doesn’t, or make a credible case for further investment.
Key Takeaways
- “Engagement improved” is not a result: without a documented baseline, a defined metric and a control group, a personalization initiative is an activity, not an experiment. Activities consume budget. Experiments generate evidence.
- The 5–25% ROI spread is a measurement problem: McKinsey’s research shows personalization drives a 5–25% revenue lift, most commonly 10–15%. The difference between the top and bottom of that range is explained by measurement precision, not AI sophistication, tool quality or data volume alone.
- Run a 30-day baseline before anything launches: document one metric, its current value and trend, any external factors, and the measurement window. It feels like lost time, but it’s the only thing that separates an experiment from an activity.
- Precise measurement turns results into budget: moving a specific metric from X to Y against a documented baseline is a business case. “Engagement improved” is an anecdote, and you cannot scale or budget from an anecdote.
- Five questions before you launch: one metric, its 30-day value, the minimum movement that justifies scaling, the measurement window, and what else could explain the change. If you can’t answer all five, you’re running an activity.
Why the Personalization ROI Range Is So Wide
McKinsey’s research shows that personalization drives a 5–25% revenue lift across companies, with the most common outcome in the 10–15% range. That’s a meaningful spread — a company delivering 25% lift from personalization is generating five times the return of a company at 5%.
The difference is not explained by AI sophistication, tool quality, or data volume alone. It’s explained by measurement precision.
Companies at the top of the range know exactly what moved and why. They started with a documented baseline. They defined a specific metric. They ran their initiative against that metric for a defined period and compared the result to the historical record. They knew, within a reasonable margin, whether the personalization intervention caused the lift or whether something else explained it.
Companies at the bottom of the range launched broad personalization programs and assessed success by feel. “Customers seem more engaged.” “The team feels like the campaign performed well.” These are not measurements. They are impressions. It’s the same pattern I describe in AI Didn’t Solve the Personalization Problem. It Exposed It.: the technology works, but the operational conditions (including how success gets measured) were never built.
What Real Measurement Looks Like
Let me give you a concrete example of what evidence-based personalization measurement looks like in practice.
A B2B SaaS company offering a marketing analytics platform identified a trial-to-paid conversion problem. Trial users who connected their ad account but didn’t view a campaign report within 72 hours churned at three times the rate of those who did.
The hypothesis was precise: if we can increase the 72-hour report-view rate among ad account connectors, we will improve trial-to-paid conversion.
Before launching anything, they documented their baseline: the 72-hour report-view rate for ad account connectors over the previous 30 days was 29%.
They built a single intervention: a conditional workflow that identified trial users who connected an ad account but hadn’t viewed a report within 48 hours, then sent a platform-specific activation email with a one-click pre-built report template for their specific ad account (Google, Meta, or LinkedIn — matched to what they’d connected).
After six weeks: the 72-hour report-view rate moved from 29% to 54%. Trial-to-paid conversion for that segment improved proportionally. If trial activation is the metric you’re trying to move, I’ve laid out how to instrument and A/B test it in A Frictionless Onboarding Playbook.
That’s a result. Not “engagement improved.” A specific metric, a documented baseline, a defined intervention, a measurable outcome.
This is the R in the C.L.E.A.R. framework — Results Evidence. It’s the discipline of measuring what actually moved, not what you hoped would move.
Read the full framework: The C.L.E.A.R. Framework for Pragmatic AI Adoption
The 30-Day Baseline Discipline
The most practical change any MarTech leader can make to their personalization program is introducing a mandatory 30-day baseline period before any intervention launches.
During those 30 days, you document:
- The specific metric you are trying to move (one metric per experiment)
- Its current value and recent trend
- Any external factors that might influence it (seasonality, campaigns running in parallel, product changes)
- The measurement window for the experiment itself
This sounds obvious. It almost never happens in practice. Why? Because baseline documentation delays the launch. Leadership wants to see results. The tool is live and the team is eager. The 30-day wait feels like lost time.
It isn’t. It’s the only thing that separates an experiment from an activity. And activities, no matter how sophisticated the AI running them, cannot be scaled — because you don’t know whether they worked.
Connecting Measurement to Investment
There is a direct line between measurement precision and investment confidence.
If you can show a stakeholder that a specific personalization intervention moved a specific metric from X to Y, over a 30-day window, against a documented baseline, and calculate the revenue value of that movement — you have a business case. You can scale the intervention, replicate it in adjacent segments, and request additional budget with evidence behind the ask.
If you can only show that “engagement improved,” you have an anecdote. You cannot scale an anecdote. You cannot budget from an anecdote.
McKinsey’s personalization outperformers run hundreds of experiments per year — not because they have unlimited resources, but because each experiment produces usable evidence. The evidence compounds. The program scales. The return grows.
Companies at the bottom of the 5–25% lift range are running fewer experiments with less precision and generating less evidence. Their personalization programs plateau — not because the ceiling is low, but because they can’t prove which lever to pull next.
What Real-World Scale Looks Like When Measurement Is Done Right
McKinsey’s January 2025 research puts numbers to what measurement-led personalization can achieve at enterprise scale. A large North American retailer that rebuilt its analytics infrastructure around precise measurement — A/B testing promotional propensity models over two-week sprints, with clear before/after tracking — generated $400 million in value from pricing improvements and an additional $150 million from gen AI–enabled targeted offers in a single year.
A European telecom that instrumented its personalization properly — tracking open rates, engagement, and conversion against a documented non-personalized control group — demonstrated 10% higher engagement from gen AI-personalized messages. That 10% number only exists because they measured correctly. Without the control group, it would have been “engagement improved.”
McKinsey also notes that gen AI now enables content development 50 times faster than manual approaches — but speed without measurement discipline simply produces more unmeasured output, faster.
The Measurement Checklist
Before any personalization initiative launches, I recommend running through five questions:
- What is the one metric this experiment is designed to move? (Not three metrics. One.)
- What is the documented value of that metric over the last 30 days?
- What is the minimum movement in that metric that would justify scaling this intervention?
- What is the measurement window? (When will you call the result?)
- What else is changing in the same period that could explain a movement in this metric?
If you can answer all five before you launch, you’re running an experiment. If you can’t, you’re running an activity.
The $1 trillion personalization opportunity McKinsey identified is real. The companies claiming their share of it are the ones who can prove — with precision — that their personalization is driving the revenue. Build the measurement discipline first. The results will follow.
At a Glance: Personalization ROI in Numbers
| Figure | Source | |
|---|---|---|
| The ROI range | Personalization drives a 5–25% revenue lift across companies | McKinsey |
| Most common outcome: 10–15% lift | McKinsey | |
| A company at 25% lift generates 5× the return of one at 5% | Derived from the McKinsey range | |
| Measurement done right: field example | B2B SaaS trial users: 72-hour report-view rate moved from 29% to 54% in six weeks, against a 30-day documented baseline | Client engagement (this post) |
| Measurement done right: at scale | North American retailer: $400M value from pricing improvements + $150M from gen AI–enabled targeted offers in one year | McKinsey, Jan 2025 |
| European telecom: 10% higher engagement from gen AI-personalized messages vs. a non-personalized control group | McKinsey, Jan 2025 | |
| The speed trap | Gen AI enables content development 50× faster than manual approaches, but speed without measurement produces more unmeasured output | McKinsey, Jan 2025 |
Frequently Asked Questions
Start with an experiment, not an activity. Document a baseline for one specific metric before anything launches, define the intervention, set a measurement window, and compare the result to the historical record. Then calculate the revenue value of the movement. If you can show a metric moved from X to Y against a documented baseline, you have a business case.
McKinsey’s research shows personalization drives a 5–25% revenue lift, most commonly 10–15%. That spread isn’t explained by AI sophistication, tool quality or data volume alone. It’s explained by measurement precision. Companies at the top of the range know exactly what moved and why. Companies at the bottom launched broad programs and assessed success by feel.
It’s a mandatory period before any intervention launches. During it you document the one metric you’re trying to move, its current value and recent trend, any external factors that could influence it (seasonality, parallel campaigns, product changes), and the measurement window for the experiment. It delays the launch, but it’s the only thing that separates an experiment from an activity.
Not on its own. Which engagement metric moved? By how much, over what period, against what baseline or control group? Without those answers it’s an impression, not a measurement. The European telecom in McKinsey’s research could claim 10% higher engagement only because it measured against a non-personalized control group.
Five questions: What is the one metric this experiment is designed to move? What is its documented value over the last 30 days? What minimum movement would justify scaling? What is the measurement window? What else is changing in the same period that could explain a movement? If you can answer all five, you’re running an experiment.
It’s the R: Results Evidence. It’s the discipline of measuring what actually moved, not what you hoped would move. It’s also what makes the rest of the framework work: evidence is what lets you scale an intervention, replicate it in adjacent segments, and ask for more budget.
I’ve built measurement frameworks like this across 3 personalization engagements — the kind where leadership can see exactly what moved, why, and what it’s worth. If your team is running activities instead of experiments, I can help as a project consultant or in a full-time role. Connect on LinkedIn or email harish@psharish.com.
By PS Harish
18 August 2026Comments
No comments yet.



Leave A Comment