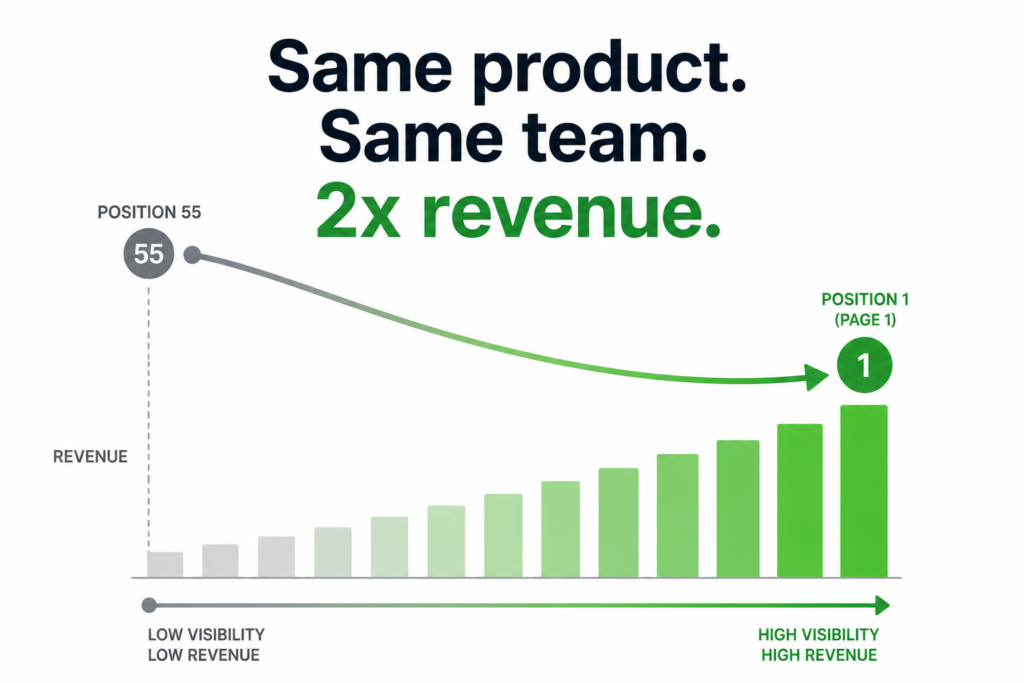
There’s a growth equation most e-commerce brands never run. It doesn’t require a new product, a bigger team, or a new ad budget. It starts with one number most teams don’t even track:
Average keyword position.
Not traffic. Not conversions. Not revenue by channel. Position.
Because position is the root cause. Everything else is a downstream consequence.
Key Takeaways
- Average keyword position is the root-cause metric for organic growth. The causal chain is Position → Traffic → Conversion → Revenue, so improving conversion while position is broken is fixing a funnel nobody is entering.
- In the audit behind this post, an e-commerce brand had been flat at ~$30,000/month for 18 months in an industry growing 8% a year. Its average position across 549 keywords with impressions was 55, which is page 5–6 territory.
- Moving from position 55 to 45 was modeled at +30–40% revenue ($9,000–$12,000/month). Reaching page 1 was modeled at 2x current revenue or more, with no new ad spend and no new product lines.
- Near-miss keywords (positions 11–20, with impressions but almost no clicks) are the fastest win. Improving them takes about 4–6 weeks per cluster, and revenue impact shows in 60–90 days.
- Most marketing dashboards leave out the three numbers that matter here: average keyword position and its trend, position distribution across the portfolio, and revenue potential at page 1 vs. current revenue.
The Audit That Changed the Conversation
I was reviewing the SEO performance of an e-commerce brand that had been generating roughly $30,000 per month in revenue — for 18 consecutive months. Flat. No growth. In an industry growing at 8% year over year.
When I pulled their keyword data, one number stood out immediately:
Average keyword position: 55.
That’s not page 2. That’s not even page 4. That’s deep in page 5–6 territory, where almost no human searcher has ever ventured.
The brand had 549 keywords with impressions. They were ranking on page 1 for a handful of them — mostly obscure, branded, or near-zero-volume terms. For every revenue-driving category keyword? Pages 5, 6, 7, 10.
The Math That Should Be In Every Growth Review
Here’s the model I built to quantify the opportunity:
Current State
- Average position: 55
- Monthly revenue: ~$30,000
- Conversion rate: 1.56%
- Average order value: $44
Scenario 1 — Position 55 → 45
Moving 10 positions still keeps you off page 1. But organic CTR curves show even position 11–20 captures 1–2% of search volume vs. near 0% at position 55.
Estimated revenue impact: +30–40% That’s an additional $9,000–$12,000/month. Same products. Same team.
Scenario 2 — Position 55 → Page 1 (Position 1–10)
Page 1 captures 70%+ of all clicks for a given query. Position 1–3 alone captures 30–40%.
For a brand with 110,000 monthly searches in just the dog treats category:
- Page 1 visibility = 11,000–16,500 visitors/month from one category
- At 1.56% conversion = 172–257 orders
- At $44 AOV = $7,500–$11,300/month from one category
Extrapolate across the full keyword portfolio and the total opportunity is a multiple of current revenue.
Estimated revenue impact at page 1: 2x current revenue or more.
No new ad spend. No new product lines. Just visibility.
And that math holds average order value at $44 — a separate lever I break down in Average Order Value: The Growth Lever Most E-Commerce Brands Completely Ignore.
At a Glance: The Position 55 Snapshot
| Starting point | Average keyword position 55 across 549 keywords with impressions (page 5–6) |
| Revenue baseline | ~$30,000/month, flat for 18 months, in an industry growing 8% YoY |
| Conversion rate / AOV | 1.56% / $44 |
| Scenario 1: position 55 → 45 | +30–40% revenue, about $9,000–$12,000/month more |
| Scenario 2: position 55 → page 1 | 2x current revenue or more |
| One category alone (dog treats) | 110,000 monthly searches → $7,500–$11,300/month at page 1 |
| Fastest win | Near-miss keywords (positions 11–20): 4–6 weeks per cluster, impact in 60–90 days |
| Investment needed | No new ad spend, no new product lines, same team |
Why Position Is the Right Starting Point
Most growth audits start with traffic. That’s the wrong entry point.
Traffic is a function of position. If your position is broken, more content won’t fix traffic. More ad spend won’t fix organic traffic. Better landing pages won’t fix a funnel nobody is entering.
Position → Traffic → Conversion → Revenue
This is the causal chain. Optimizing conversion when position is broken is like improving your checkout flow when your storefront is on a street nobody walks down.
Once I’ve seen revenue by channel — the first thing I ask for, as I explain in Why Attribution Data Is the First Thing I Ask For in Any Growth Audit — position distribution is where I start on SEO, for exactly this reason:
- What’s your average position across all keywords with impressions?
- How many keywords sit in positions 11–30 (close to page 1, high opportunity)?
- How many keywords with high search volume are buried on pages 5+?
This profile tells me more about the revenue opportunity in five minutes than a month of traffic analysis.
The “Near Miss” Keywords Are Your Fastest Win
In every C.R.A.W.L. Audit I run, there’s a category I call near-miss keywords — terms where you’re ranking at positions 11–20, generating impressions but almost no clicks.
These are your fastest wins because:
- Google already knows your content is relevant for these queries
- You need a ranking improvement, not a content-from-scratch investment
- A 5–8 position improvement can move you from page 2 to page 1
The typical near-miss keyword intervention:
- Improve on-page content depth and structure for existing pages
- Build 3–5 relevant internal links pointing to those pages
- Improve page experience signals (load time, mobile UX, Core Web Vitals)
- Add structured data where applicable (product schema matters for AI shopping agents too — see The LLM Visibility Gap: Why Most E-Commerce Brands Are Already Invisible to AI Search)
This is a 4–6 week effort per cluster, not a 6-month project. And the revenue impact starts showing in 60–90 days.
The Metric Your Monthly Report Is Missing
Most marketing dashboards show:
- Sessions
- Bounce rate
- Conversion rate
- Revenue
Almost none show:
- Average keyword position (and trend)
- Position distribution across the portfolio
- Revenue potential at page 1 vs. current revenue
The last three are where the growth story actually lives. If your report doesn’t include them, you’re tracking consequences without understanding causes.
What Happens If You Don’t Fix This
Organic position isn’t neutral. While you stay at position 55, the brands on page 1 are compounding their advantage:
- More clicks = more behavioral signals to Google that their content is relevant
- More revenue = more budget to invest in content and links
- More visibility = more brand searches, which further reinforce rankings
The gap between position 55 and page 1 doesn’t stay fixed. Left unaddressed for 12 months, it becomes a 24-month problem. If you want to put a monthly number on that drift, The Cost of Inaction: What Stagnant SEO Actually Costs You in Revenue walks through the calculation.
Three Actions to Start This Week
- Export your Google Search Console query data — filter for queries with >100 impressions in the last 90 days and sort by average position.
- Identify your near-miss keywords — positions 11–20 with >500 monthly impressions. These are your 90-day opportunities.
- Run the revenue math — apply the position → CTR → conversion → AOV model to your top 10 near-miss keywords. The number will tell you what to prioritize.
Frequently Asked Questions
It’s your average ranking across every keyword you get impressions for. I treat it as the root cause, because traffic is a function of position. If position is broken, more content, more ad spend or better landing pages won’t fix organic traffic. The chain runs Position → Traffic → Conversion → Revenue.
For the brand in this post (~$30,000/month, 1.56% conversion, $44 AOV), moving from 55 to 45 was modeled at +30–40%, or $9,000–$12,000 more a month. Reaching page 1 was modeled at 2x current revenue or more. Dog treats alone, at 110,000 monthly searches, was worth $7,500–$11,300/month at page 1.
Organic CTR curves show that even positions 11–20 capture 1–2% of search volume, compared with near 0% at position 55. You’re still off page 1, but you’ve moved from invisible to getting clicks.
Terms where you already rank at positions 11–20 and get impressions but almost no clicks. They’re the fastest win because Google already considers your content relevant. You need a ranking improvement, not new content from scratch, and a 5–8 position gain can take you from page 2 to page 1.
About 4–6 weeks of work per cluster: deeper on-page content, 3–5 relevant internal links pointing to the page, better page experience (load time, mobile UX, Core Web Vitals) and structured data where it applies. Revenue impact usually starts showing in 60–90 days.
Average keyword position and its trend, position distribution across the portfolio, and revenue potential at page 1 vs. current revenue. Sessions, bounce rate and conversion rate track consequences. These three show the cause.
I’m a growth marketing and analytics professional currently exploring new opportunities. If your brand is stuck in a position rut and you want someone who can turn position data into a revenue growth plan — connect with me on LinkedIn or reach out at harish@psharish.com.
By PS Harish
4 August 2026Comments
No comments yet.


Leave A Comment