Before I look at traffic. Before I look at keyword rankings. Before I look at conversion rates or funnel drop-off or email open rates.
Day 1 of any growth engagement, I ask for one thing:
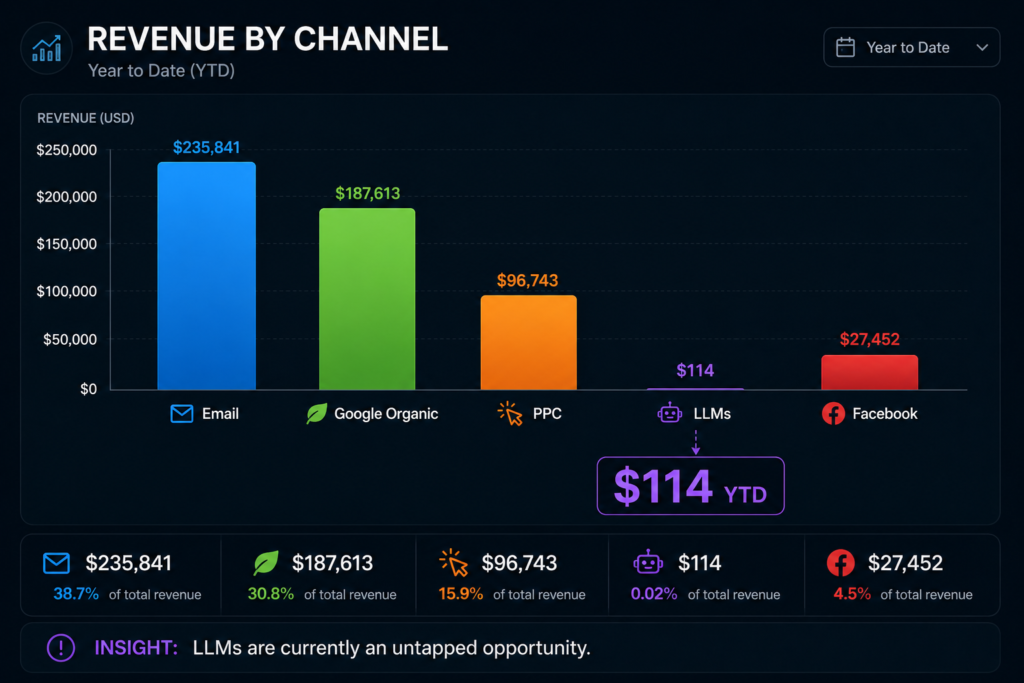
Show me revenue by channel.
Email. Google Organic. Paid Search. Paid Social. LLMs. Direct. Referral.
Not sessions. Not impressions. Not engagement rate.
Revenue.
This single request tells me more about a marketing organisation than any deck, dashboard, or strategy document they could share.
Key Takeaways
- On day one of any growth audit, I ask for one report before anything else: revenue by channel. Not sessions, not impressions, not engagement rate.
- How fast a team can produce that report is a diagnostic in itself. Clean data in under 10 minutes means a data-led operation. Siloed data and inconsistent channel definitions mean decisions have been made on instinct.
- In one audit, a team said it had an LLM strategy. Google Analytics showed $148 in combined ChatGPT and Perplexity revenue over six months. Attribution showed the gap between the narrative and reality.
- My baseline report covers five channel categories, each split so they don’t hide each other: organic (branded vs. non-branded), paid search (by campaign type), email (by campaign type), social (organic vs. paid), and AI/LLM referrals.
- The most common attribution failure is inconsistent UTM tagging, not bad tooling. Untagged revenue collects in an inflated “Direct” channel, and Direct above 30% of revenue is a signal to audit tagging.
What Revenue by Channel Actually Reveals
When a team can pull clean attribution data in under 10 minutes, it signals they’re running a data-led operation. They know what’s working, they measure it in money, and they make decisions accordingly.
When a team struggles — data is siloed, channel definitions are inconsistent, nobody can agree on which platform’s number to trust — that tells me something more important: the team has been operating on instinct and assumption, not evidence.
Attribution isn’t just a reporting exercise. It’s a diagnostic.
Here’s what I’m looking for when I read a channel attribution report:
→ Which channels are generating revenue vs. generating noise? A channel with high traffic and low revenue conversion has a targeting or intent mismatch. A channel with low traffic and high revenue often deserves more investment. Most teams do the opposite of what the data recommends.
→ Where has the team been spending time and attention? Budget and headcount follow perception, not data. Attribution shows you the gap between where the team believes value is being created and where it actually is.
→ What claims can’t be substantiated? This is the one that matters most.
The $114 Reality Check
In a recent audit, a team told me they had an LLM strategy. Content was being optimised for AI search. Agentic commerce was on the roadmap.
I asked for the attribution data.
Here’s what Google Analytics showed for January through June:
- ChatGPT: 76 sessions. $114 in revenue.
- Perplexity: A handful of sessions. $34.
- All other LLMs: Essentially zero.
Six months. Two AI channels. $148 combined.
The team had documentation suggesting they were “already seeing revenue through multiple LLMs.” The attribution data told a completely different story.
This wasn’t a data quality issue. The tracking was working. The LLM strategy simply hadn’t been built yet — it existed in plans and presentations, not in execution.
Without attribution data, that gap stays invisible. The team continues to believe progress is happening. Leadership continues to believe the box is checked. Meanwhile, competitors are pulling 1,000x more AI-driven sessions.
Attribution surfaces the gap between narrative and reality. I wrote up the full story of that audit — and the three levers that actually move AI visibility — in The LLM Visibility Gap in E-Commerce.
The Five-Channel Attribution Report I Build First
When I set up attribution for a new engagement, I want clean data across five categories at minimum:
1. Organic Search (split by branded vs. non-branded) Non-branded organic is the truest measure of SEO health. Branded organic tells you about brand strength and repeat intent. Mixing them produces a number that flatters SEO performance.
2. Paid Search (split by campaign type) Brand campaigns, non-brand campaigns, and shopping/product listing ads behave differently and have different margin implications. Aggregating them hides poor performance in high-spend non-brand campaigns.
3. Email (segmented by campaign type) Promotional campaigns, automated flows (welcome, abandon cart, post-purchase), and broadcast newsletters each have different economics. Flow revenue is typically 3–5x more efficient per dollar spent — if you can’t see it separately, you can’t optimise it. And if your flow revenue looks low, check the seven root causes of broken marketing automation before you blame the channel.
4. Social (organic + paid, split) Organic social rarely drives direct revenue but is a meaningful assist channel. Paid social has a direct cost. They should never share a row in a channel report.
5. AI / LLM channels This is the new frontier. Google Analytics now captures sessions from ChatGPT, Perplexity, Copilot, and others under the “Referral” or direct source. If you’re not looking for it, you won’t see it. If you’re not seeing it, you can’t build a strategy around it.
The Attribution Problem Most Teams Have
The most common attribution failure I see isn’t bad tooling. It’s inconsistent source/medium tagging.
Campaigns go out without UTM parameters. Affiliate links aren’t tagged. Email newsletters sometimes use UTM, sometimes don’t. The result is an inflated “Direct” channel that absorbs all the revenue nobody bothered to tag.
Your “Direct” channel is a graveyard of unattributed marketing spend.
The fix isn’t complicated:
- Mandate UTM parameters on all external links (email, social, ads)
- Audit your top 20 traffic sources monthly for proper tagging
- Set up a UTM naming convention your whole team follows
Once you clean up attribution, the channel picture that emerges is usually both more accurate and more actionable than what teams assumed.
At a Glance: The Five-Channel Attribution Report
| Channel | Split it by | Why the split matters |
|---|---|---|
| Organic Search | Branded vs. non-branded | Non-branded is the truest measure of SEO health. Mixing them flatters SEO performance |
| Paid Search | Campaign type (brand, non-brand, shopping/PLA) | Aggregating hides poor performance in high-spend non-brand campaigns |
| Campaign type (promotional, automated flows, newsletters) | Flow revenue is typically 3–5x more efficient per dollar. You can’t optimise what you can’t see | |
| Social | Organic vs. paid | Organic is mainly an assist channel. Paid has a direct cost. They never share a row |
| AI / LLM | Source (ChatGPT, Perplexity, Copilot, others) | These show up under Referral or Direct. If you don’t look for them, you won’t see them |
From Attribution to Action
Attribution data is only valuable if it changes decisions. Here’s the direct line from data to action:
| Attribution Finding | Action |
|---|---|
| Organic driving high revenue but declining position | Increase SEO investment now |
| Email flows driving 5x more revenue than broadcast | Invest in flow automation expansion |
| Paid search spend not returning positive ROAS | Pause or restructure campaigns |
| LLM channels showing near-zero revenue | Build LLM visibility strategy |
| Direct channel > 30% of revenue | Audit UTM tagging — revenue is unattributed |
The audit answers what’s happening. Attribution tells you why. The action plan follows from that, not from gut feel or competitor imitation.
Start Here
If you’ve never run a clean channel attribution report, here’s the minimum viable version in Google Analytics 4:
- Go to Reports → Acquisition → Traffic Acquisition
- Change the primary dimension to Session Source / Medium
- Set the date range to the last 6 months
- Add Revenue as a secondary metric (or set it as your primary conversion)
- Sort by revenue descending
What you see in the first five rows will tell you more about your marketing reality than the last six months of strategy meetings.
Frequently Asked Questions
Because revenue by channel tells me more about a marketing organisation than any deck, dashboard or strategy document. It shows which channels generate revenue and which generate noise, where the team’s time and budget have gone compared with where value is actually created, and which claims the data can’t back up.
If a team can pull clean attribution data in under 10 minutes, it’s running a data-led operation. If it struggles because data is siloed, channel definitions are inconsistent, or nobody agrees on which platform’s number to trust, the team has been operating on instinct and assumption rather than evidence.
At minimum, five: Organic Search split by branded and non-branded, Paid Search split by campaign type, Email split by promotional campaigns, automated flows and newsletters, Social split into organic and paid, and AI/LLM referrals. Each split matters because combining them hides poor performance or flatters a channel.
Go to Reports → Acquisition → Traffic Acquisition, change the primary dimension to Session Source / Medium, set the date range to the last six months, add Revenue as a metric, and sort by revenue descending. The first five rows will tell you more about your marketing reality than months of strategy meetings.
Usually because of inconsistent UTM tagging: campaigns sent without UTM parameters, untagged affiliate links, newsletters that only sometimes use UTMs. That revenue ends up in Direct. If Direct is more than 30% of revenue, audit your tagging. Mandate UTMs on all external links, check your top 20 traffic sources monthly, and agree one naming convention.
Google Analytics captures sessions from ChatGPT, Perplexity, Copilot and others under Referral or Direct sources, so you have to look for them specifically. In one audit, that check showed $114 from ChatGPT and $34 from Perplexity over six months, even though internal documents claimed revenue “through multiple LLMs.”
I specialise in growth marketing audits — like the C.R.A.W.L. Audit — that start with data, not assumptions. Currently exploring new full-time opportunities in growth, marketing operations, and digital strategy. If you’re building a data-driven marketing function — connect with me on LinkedIn or reach out at harish@psharish.com.
By PS Harish
28 July 2026Comments
No comments yet.



Leave A Comment